
Today I have released LibDebugLogger 2.0 and a new version of the in-game DebugLogViewer to accompany it, but this is only a small part of what I have been busy with. I proudly present the external Log Viewer. This tool can be used to inspect LibDebugLogger saved variable files in new ways and as if that is not amazing enough already, it also allows to share log files with others!
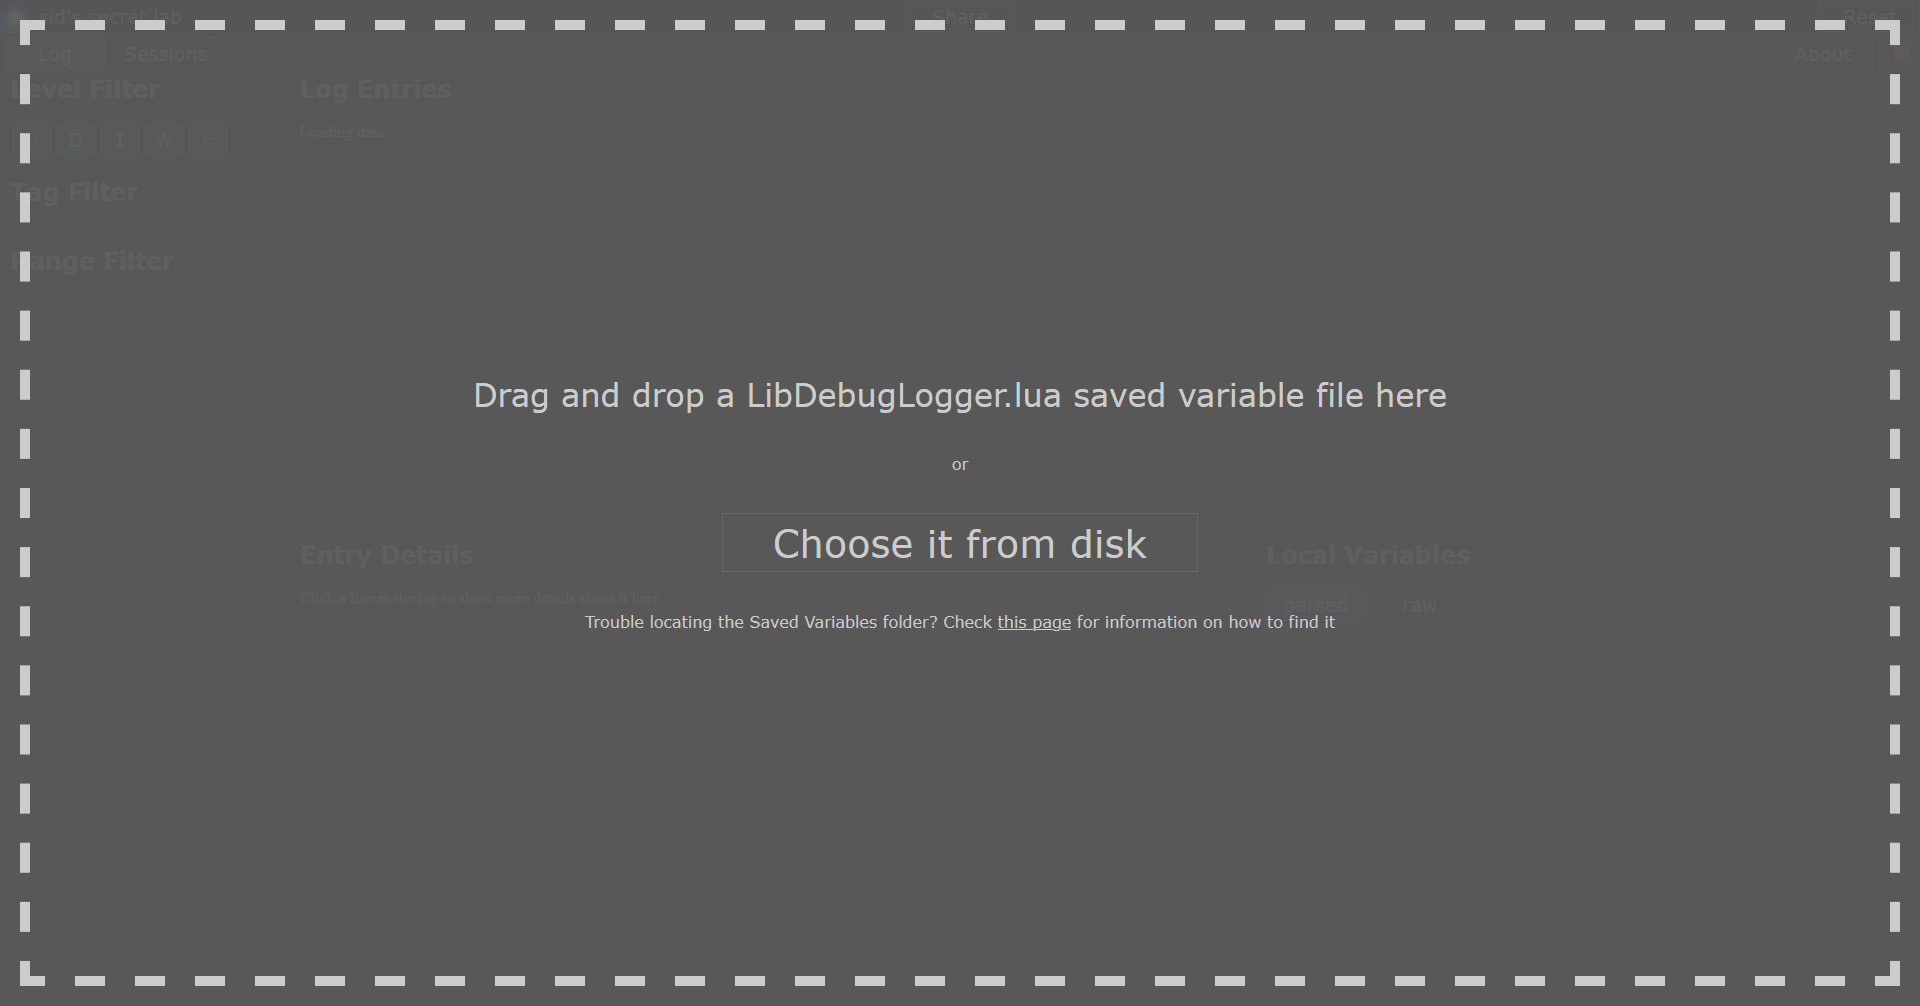
The Log Viewer uses modern web technologies to load and visualize the data locally. Once a valid file has been selected, it will parse the content and offer different ways to look at what has been logged by the library.
The data won’t leave your machine unless you press the “Share” button on the top. In that case it will compress and upload the log file and show a url which can be shared with other people. The link will be valid for 14 days and when they visit it, they will be greeted by your log file right away.
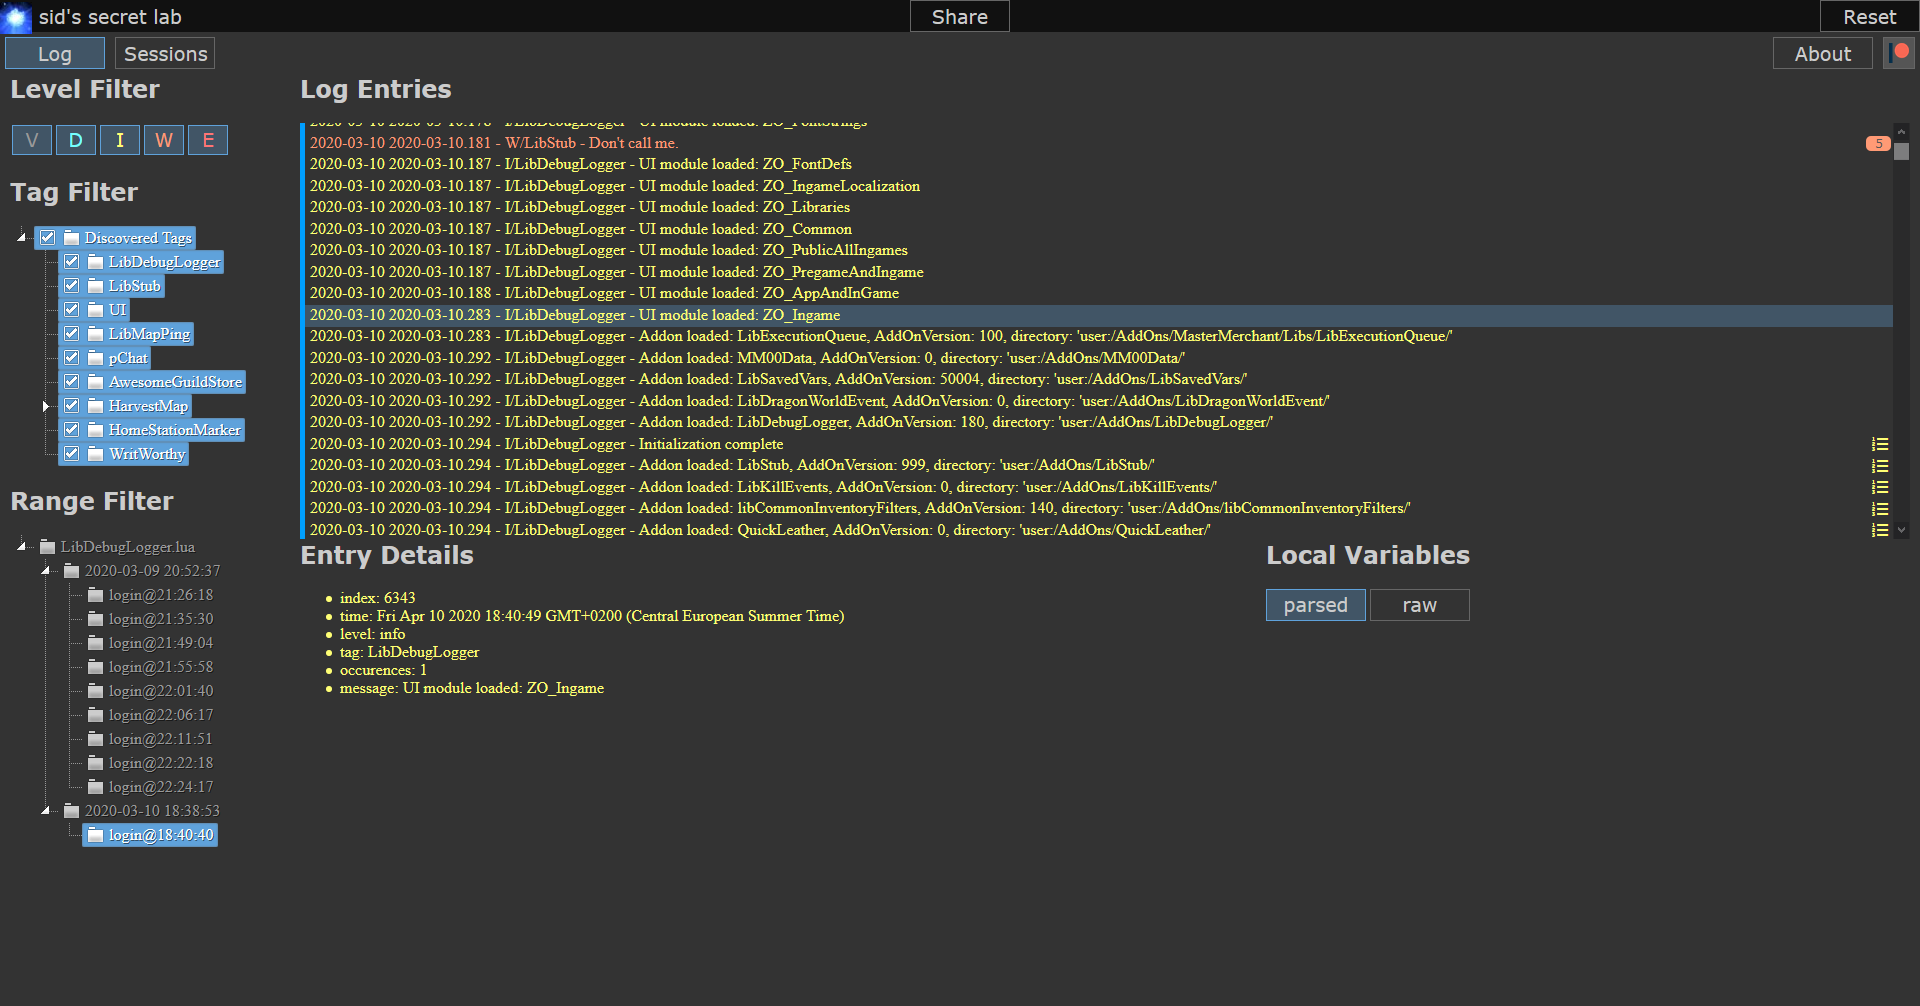
The viewer currently offers two ways to visualize the data. The Log view will simply show messages in the log file. Entries that got logged during a loading screen show a blue line on the left side. On the right side of each entry it will also show if a stack trace is available or if the entry has been logged more than once in a row.
The filters on the left side can be used to select different log levels, tags or time frames. When an entry is clicked on, it will show all the available details. Though the really interesting magic will only happen when stack trace logging is enabled.
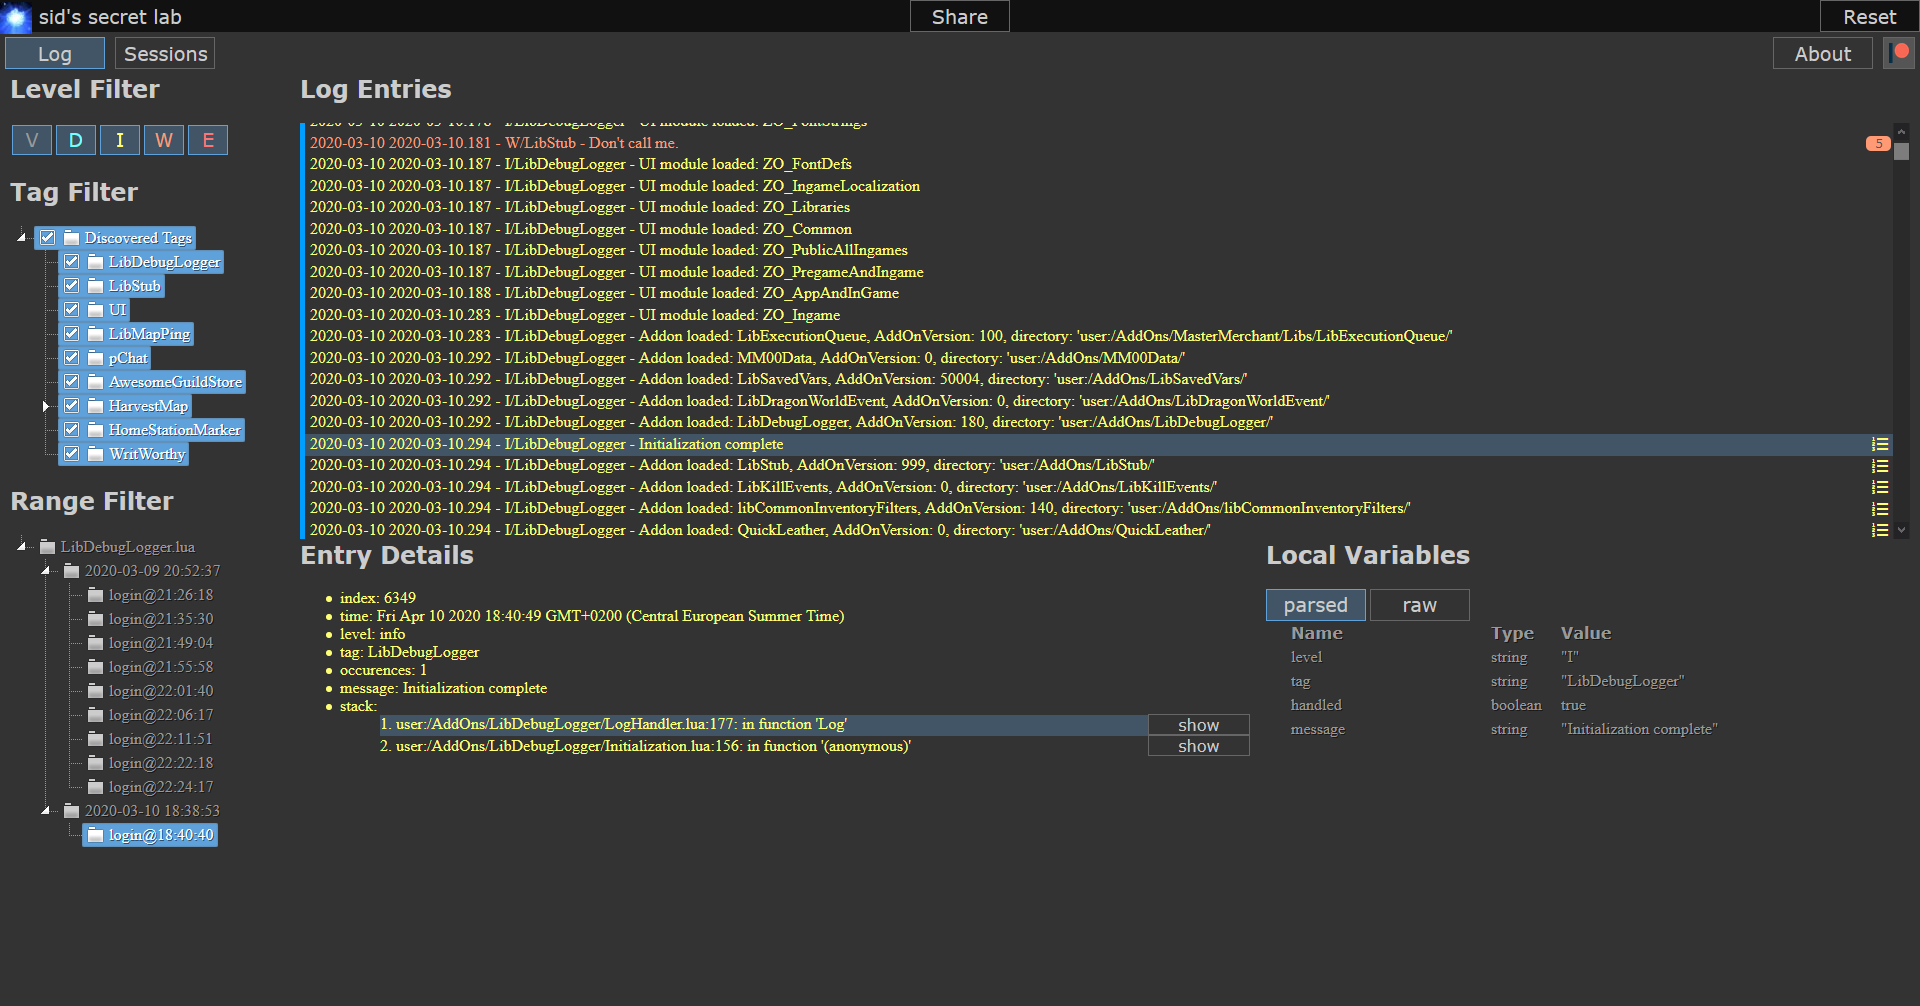
Thanks to ZOS the stack traces include the local variables for each closure. The viewer parses them and shows them in an orderly fashion which is easier to understand than the raw text.
The best part about that is that it will recognize function references and offer a “Show” button in the stack trace or simply make them into a link in the local variables which can be clicked. It will then open a custom url protocol (“esoui-dev”) which can be configured to open the respective file in an editor of your choice. The setup is a bit complicated, but the necessary steps and a template for a handler script for Windows are included on the “About” tab.
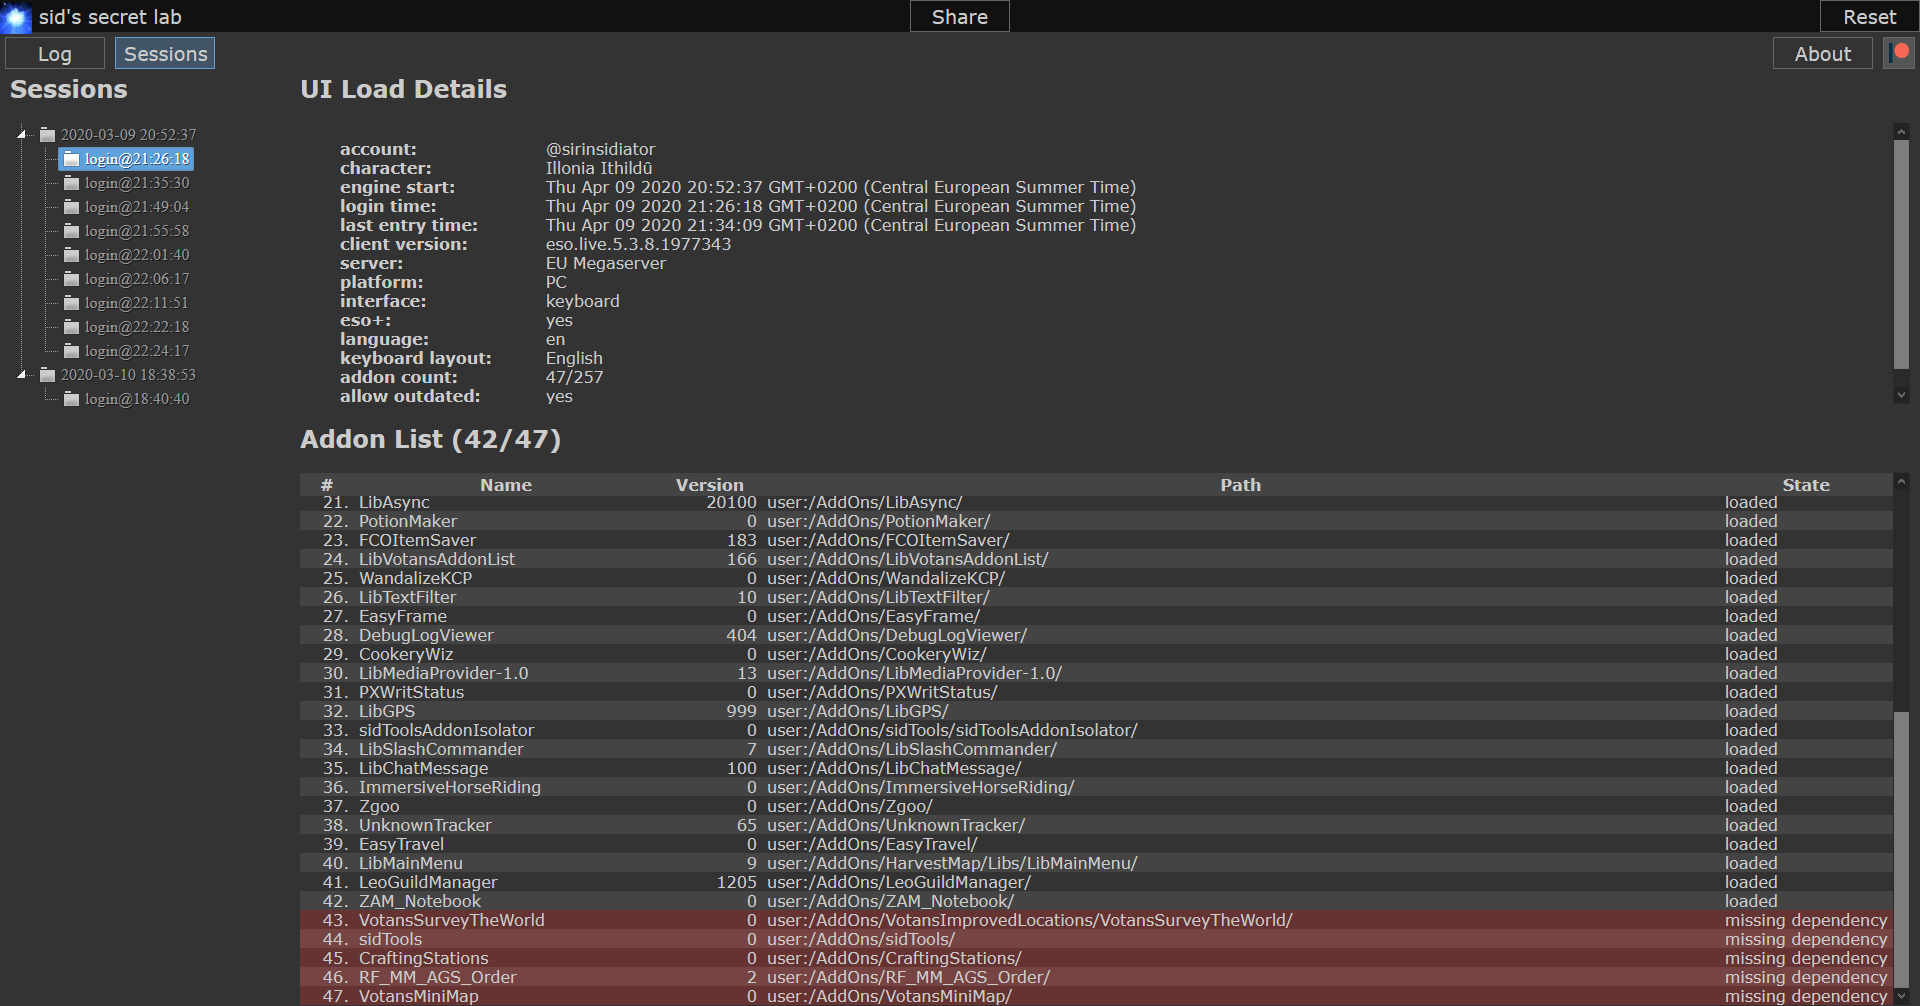
The session view on the other hand allows to quickly see some basic information about the logged in character and UI configuration, as well as used add-ons. The add-ons are listed in the order they are loaded in by the game, with enabled but not loaded add-ons shown at the end of the list.
I hope this new tool in the ESO add-on development toolbox will come in handy and help many authors in finding and fixing bugs going forward.